Friday, March 10, 2023

Fixing the Photocopy Lines, Part 2

 We have spent months, literally months, trying to fix the code that uses a Hough transform to find the little white lines introduced by the photocopying process and have more problems than we anticipated.   First our code does not find all the white lines, and second it finds lines where there are no lines.

The first problem seems to be because there are lots of potential white lines, since there are so many white pixels.  The second is that some parts of the images seem to be just so that, in isolation, they can be interpreted as being part of a white line, when they are not.

But in working with the images,  I noticed that if you look at the lines so that you can see the individual pixels, like:

You can see that the white lines tend to be represented by small groups of disconnected white pixels.  It is only when you get a really big white line that you get long sections of white pixels.  And the small groups of pixels seem to be in repeating patterns. For example in the above image, the last group of pixels in the last line is repeated earlier in that line, as well as in the line above it.

So it looks like, if we scan the images for small groups of white pixels -- say something that would fit in an 8x8 square, and count how many times those patterns are repeated in the images, then we can take the most common ones and when we find them in an image, fill them n with black.

In fact we can use the partially fixed images from using the Hough transform and diff them with the original images to get just bits that we believe are in little white lines.  From that we can produce a list of the most frequent patterns, and then use those patterns on the original images to find a larger set of little white lines.

Writing a program to find the patterns, produces thousands of potential patterns, but looking at the frequencies, most patterns occur in just a few places -- less than 10.  There are 776 patterns of more than 10 occurrences, and they are no bigger than 7x7.

A second program can find those patterns.  The pattern is all white, but we believe it should be black.  To observe what we are finding, we set the pixels to green.  This produces an output file like:

Notice that a lot of the previous white lines have been filled in.  Not all of the line is filled in, since we are requiring each pattern to be white pixels surrounded by black pixels.  If the white pixels are too close, we do not replace them.  And if the white line is just too big, we don't find anything at all.  And if the white line goes thru a vertical black line, just leaving a gap in the black line, we miss that too.

But if we now use these green pixels to drive a Hough transform, we may be able to better identify the lines, and then go back and fill in the missing white pixels.  We will try that next.

Oh, and if we just count the number of green pixels on a page and plot that, ordered by the number of pixels, tagging each file with it's file name, it becomes clear that the problem is almost exclusively with the odd pages (the back sides) and not the even pages.
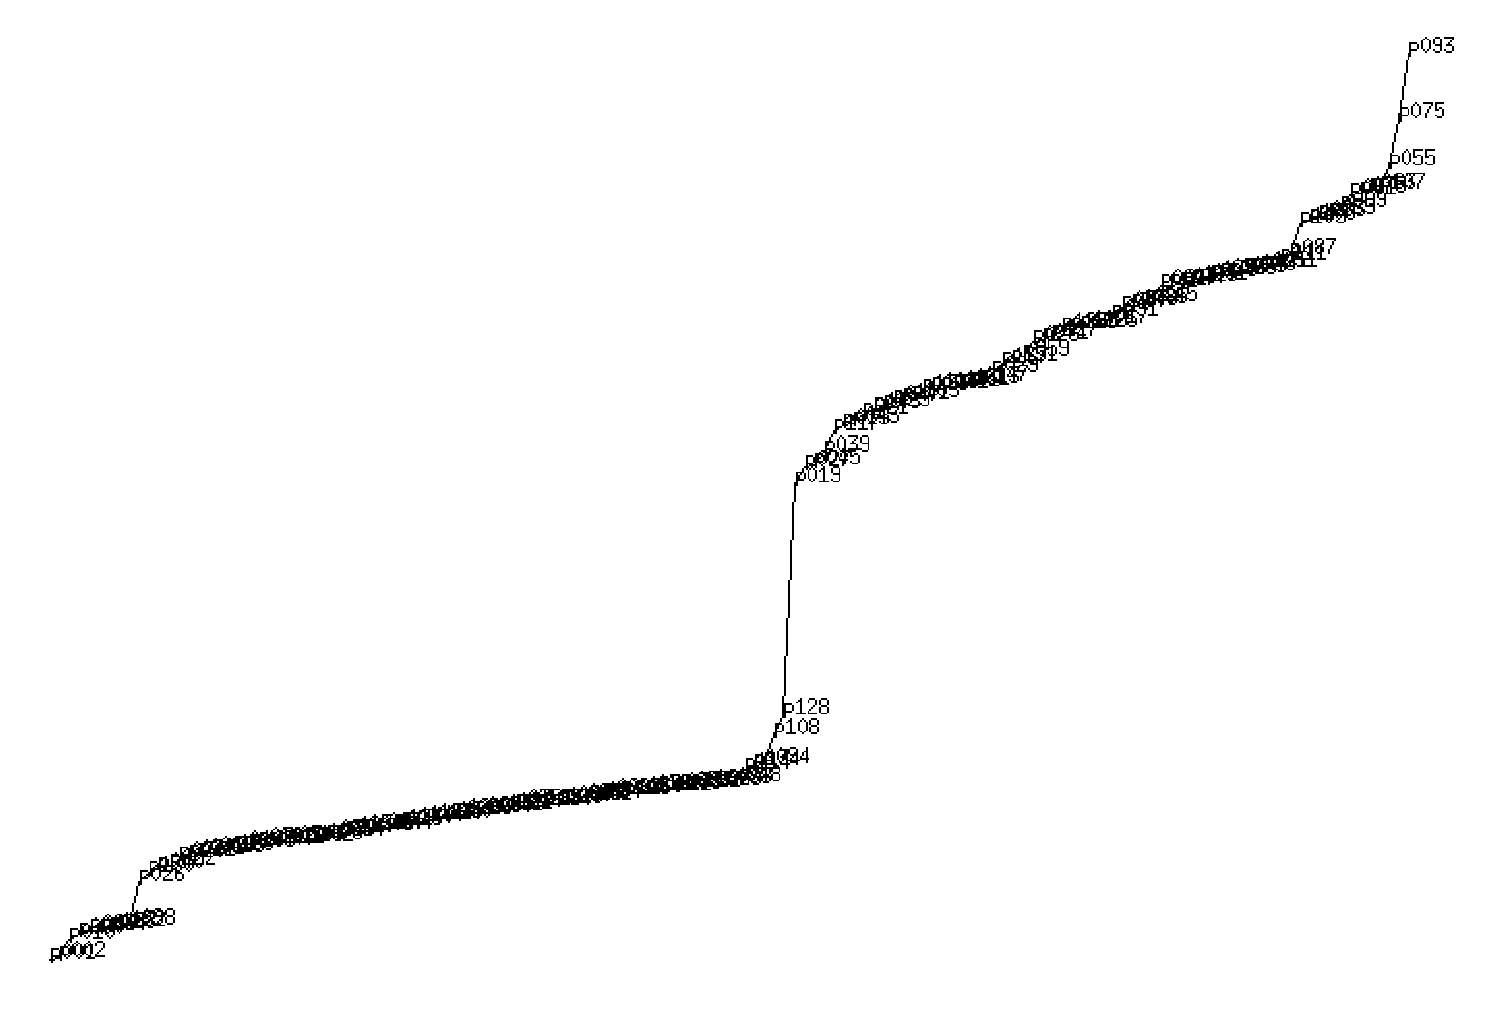

The sudden jump in the number of green pixels is from 20K green pixels for p128 to 40K green pixels for p019.  All of the even pages are below p128, and all of the odd pages (except one) are above p019.  The exception is p001 which has no green pixels.  p001 is the copyright page, which we had to process by hand to make visible.

But even the even pages can have thousands of green pixels, which when looked at closely show a lower level of the same photocopy problem.  So our techniques will be applied to all the pages.


Monday, December 26, 2022

Fixing the Photocopy Lines


From reading graphics processing books, it appears that fixing the thin little horizontal lines that have been introduced into the images by the photocopying process should be fairly easy.  All we have to do is use a Hough transform.  

A Hough transform is used to find straight lines in an image.  The idea is to look at each pixel and say "if there was a straight line going thru this point, what would it be?".   The equation for a line with slope a and y-intercept b going thru the point (x,y) is y = ax+b.  Now if we have (x,y) and want to solve for a and b, that would be better presented as b = y - ax.  Now give x, y and a we can solve for b.  

A Hough transform defines an accumulator matrix m and stepping thru the possible slopes, a, computes b = y - ax for each allowable a and adds one to the location in the matrix defined by m[a,b].  The idea is that if the line is actually there, all the points along the line will add to m[a,b] for the line with a particular slope a and intercept b.  All the non-lines will just sort of add randomly to other locations in the matrix.  So the matrix locations with large counts correspond to lines and the others are all just noise.

There are problems with this approach when the slope approaches vertical since the slope tends towards infinity, but in our case we are only interested in horizontal (or mostly horizontal) lines.  In fact, we expect that if we limit our work to each panel of a strip, instead of an entire strip, then the skew will be minor and we are actually looking for horizontal lines.  In that case a = 0, and we simply accumulate into a vector m[b] whenever  for a line defined by b = y + 0x or just b = y.

So for each point (x,y) that we think might be on a line, we add one to m[y] and look for the high values of the resulting vector.

So we are interested in a point if it is on a line.  We know the lines look like:


So we look for a column with a small number of white pixels with black pixels above and below.  Then we accumulate the number in a particular row, and look for the rows with the largest accumulation.  For a row like that, we then step down it looking for the small cluster of white pixels and setting them all to black.

There are some parameters for this, like how many white pixels in a row, and how many black pixels above and below the white pixels.  We start with up to 5 white pixels and needing 10 black pixels above and below.

As we suspected, the fine white lines mainly show up on the odd numbered files, which would be the left hand pages, which was the "back" of the sheets as they were copied. 

When we use this approach, we find two types of errors.  One is some very noticeable white lines that are not caught. Going thru all 1884 panels, we find 150 that still need work.

Some of those are because the white lines are big than we anticipated.  For example, here on panel 3 of strip 4 on p013, the white line is sometimes 6 pixels high.


Another problem is where we have what we think might be a white line, but is actually part of the original art.  For example in the 2nd panel of the 2nd strip of p034, we have the following art:


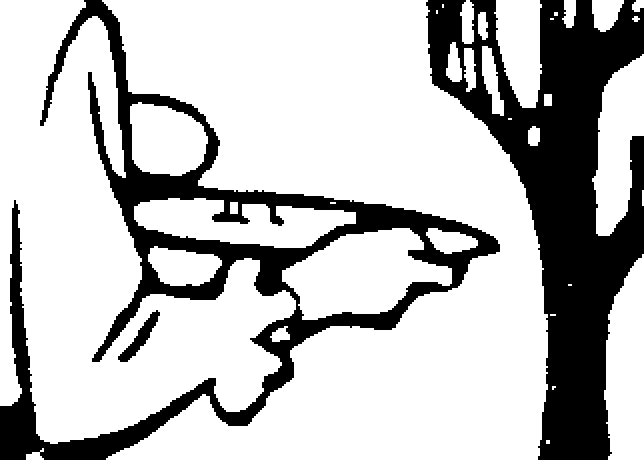
Which actually has no white lines in it.  But notice that there are two marks on the plate, just below the top rim.  The distance here between the white and the black is such that my code things this is part of a thin white line, and fills those white pixels in, producing:


So I need to either improve my code, or ferret out all these sorts of problems and fix them by hand. 


Tuesday, December 13, 2022

Starting the Second Gordo Book

Most of the technical issues for the first Gordo book (Gordo Redux) are handled, so we turn our attention to the second Gordo Book (Gordo Galore). As with the first one we scanned it at 600 dpi. Then we can run the same set of programs we used on the first book, convert the pages from gray scale to black and white, clean up the images, to create the cboxes and pull the individual strips out as images.

But a new problem is presented by this particular book: when it was photocopied at some point, thin white lines were introduced into the copy.  This seems particularly a problem on the backs of the pages, the left-hand sides which would be odd pages.  For example look at part of p029:


I've seen these sorts of lines on Xerox copies for decades.  They are caused by dirty or defective points in the photocopy machinery or toner. 

But we would like to identify these lines, and fill them in with the missing black to restore the original image drawn by Arriola.  

If we expand in and look at the individual pixels, we see that the lines are not constant, but rather a mixture of light and dark pixels.

When we convert this to pure black and white pixels, the picture changes somewhat, but we still have these lines.


It appears that many of these could be detected by simply changing small pieces of white surrounded by black to black, but as with the first book, there some places were that would change the image.  Although for the first book, the image we found which limited us to only clusters of 10 pixels or less was an issue of a black cluster in a white background.

Still there are some places where that would be insufficient.  If we follow the lines shown above to the left in this same image, we get:


At least for the line on the right, the little white channels breaking the otherwise solid vertical line probably should not be filled in without the context of knowing that there is a thin white line crossing the page.

To study this problem, I tried to look at where the white lines are, in this image, by examining the borders for the panels. This image has 3 panels, so a left border, two gutters of white with borders at roughly 1/3 and 2/3 horizontally, and a right border.  If I try to list the white lines at each vertical border, I get:


The largest, most obvious white lines are marked with an "@" symbol.  The numbers represent the starting row of the white line, and the number of pixels high that it is.  So "447,3" is a gap that starts at row 447 and continues to row 449.  There are a couple of things we can note from this chart.

One is that the white lines are not actually strictly horizontal.  As they move from left to right, following a white line, for this image, the row position decreases. So there is skew. The last column shows the difference between the left hand row position and the right hand row position.  For this image it decreases by  a skew of 20 to 27 pixels in the span of 4446 columns, about 0.6%.  But notice also that, at least in this case, the skew is not constant for this image, but seems to decrease, almost uniformly as the row changes.  And since the skew is not constant, it is not a property of the scanning.

And lines do not seem to appear across the entire image.  A line may stop or start in the middle of the image.  From p029, for example:


Here we see a major line towards the bottom that continues thru the image, although varying someone is "strength".  Other lines, at the top, start and stop at intervals.

If we can identify the lines, we can fill them in to change the above image to


Saturday, November 26, 2022

Laying out the pages

 In addition to the page numbers on each page (which are separate characters), we have the comic strips themselves.  Mostly we have 4 strips per page, with blank horizontal rows between them. We don't need to keep or regenerate the blank rows.  We have a program that can identify the blank rows between the strips and pull out the strips and make them separate image files. 

Checking the sizes of the images, we find them all between 4050 and 4660 pixels wide and between 1230 and 1320 pixels high.  The actual location on the page varies due to either the original layout by Arriola or the scanning process.  But having isolated each strip, we can position them on the page consistently.  Of course, we need to take account of the left-hand/right-hand nature of each page and make sure we have enough extra room on the inside margin for the binding process.

Standard page layout for an 8.5 x 11 inch piece of paper allows us 1/4 inch for both the left and right margin, plus an extra 1/8 inch for the gutter.  This means we want each page to start horizontally at 150 pixels for a left-hand page and 225 for a right-hand page.  The page would end horizontally at 4950 pixels for a right-hand page and 4875 pixels for a left-hand page.  Since each image, however, is a different size, if we pin down the starting point of an image, we don't control the ending point -- the ending point is determined by the starting point plus the length of the image. 

We have allowed 4875 - 225 = 4650 pixels for each image, but we know most images are less than this.  So we position each image so that it is right-adjusted on a right-hand page, and left-adjusted for a left-hand page.  These leaves any extra space from the image being less than maximum size in the gutter. 

The longest page (ignore the page numbers) is 5808 pixels.  Add the top margin of 300 pixels, and the last panel ends by 6108.  We can put the page numbers so that the baseline is at 6300, centered under the pages (the center being at 2512 pixels for left-hand pages and 2737 for right-hand pages.


Saturday, November 19, 2022

Fonts and characters for Gordo Redux

Having cleaned up the pages, more or less, we can then proceed to taking them apart.  Most pages consist of a couple of images (the comic strips images) and a page number.  We wrote a short program to identify and strip out the images, placing each one in a separate file, and recording where they are in a box file.  For example, page p008 is represented by the box file:

v 2
i 2gif/p008.gif 419 296 4912 1573 p008_1.gif      # 4494x1278
i 2gif/p008.gif 272 1763 4888 3034 p008_2.gif      # 4617x1272
i 2gif/p008.gif 272 3266 4905 4558 p008_3.gif      # 4634x1293
i 2gif/p008.gif 380 4771 4901 6037 p008_4.gif      # 4522x1267

which identifies the 4 strip files (p008_1, p008_2, p008_3, and p008_4) and their positions on page p008.  The "i" at the beginning of each line identifies that this is an "image" to be placed on the page.  A comment (# 4617x1272) provides the size of the image.

The other item on this page is the page number.   File p008 is page 3, and so we identify that character, and it's location on the page, with one additional line:

c 2gif/p008.gif 2523 6216 2571 6288 3      # 49x73

We obtain the location and digits of the page numbers by stripping out all the images and feeding the remaining scanned page into tesseract, the OCR program for Linux.  Tesseract is not happy scanning just a character or two, so there is quite a bit of hand work to get all the page numbers in the right places, but once we are done with that we can check that all the page numbers are correct.

Arriola used a personal style for numbering pages.  As is common, the front matter  -- the title page, dedication, foreword -- is not numbered. So page 1 starts in file p006.  Normally every page is then numbered, with page 1 on the right-hand side of a book. Since every spread has a left-hand page and a right-hand page, and page 1 is a left-hand page, all left-hand pages are odd numbers, and all right-hand pages are even numbers.

But Arriola does not apply page numbers to blank pages.  Page 9 (p014) is the end of a Section, and is an odd numbered, left-hand page.  To start the next section on a left-hand page, a blank page is inserted, for the right-hand page, and then the next section starts.  Normally the blank page would be page 10, and the new section would start on page 11.  But Arriola skips the page number for the blank page and starts the next section then as page 10.  Which means we now have an even-numbered left-hand page.

This problem occurs in three places: p015, p055, p079.  Which means that page 10, page 49, and page 72 should actually be on the blank pages before them.

We have two options: We can just reproduce the book as Arriola numbered it, or we can renumber the pages to match standard book page design.  Note that even if we follow standard design and number the blank pages, we don't have to actually print the page number on the otherwise blank page.  

While contemplating this problem, we can go ahead and use the identified page numbers to generate a font for these characters. This font has the ten decimal digits.  When we generate out book, we use the font characters to replace the scanned images for the page numbers, so that every "2" looks exactly the same.

If we decide to renumber the pages, we will generate the new page numbers from this font, so it will look the same as the original page numbers.

The one other issue with text in the book is the Foreword, file p004.  The forward is a typewritten page from Mell Lazarus.  That page is all text, and is the only text in the book (except the page numbers).  We go back to the original scanned image and feed that into tesseract to OCR the characters.  Again there are missing characters and mis-identified characters, but with some work, we get a box file identifying each character and where it goes on the page.  

The Foreword page is typewritten, which is a different type face from the page numbers, so we again use the characters from the page to generate a font.  However, faced with the need to go back and edit those characters (with a limited number of characters, some of the automatically generated characters in the font are rather rough), I realized that we have a typewriter font already from the Willamette High School literary magazine, and so decided to try that.  It works! So now we have that page done.  There is some work to make sure that each character is sitting on the base line perfectly, since scanned characters can easily be up or down a pixel or two.

As we are processing p004, we notice two typos on the page: (1) a space before a comma in one place and (2) a use of a semi-colon which should be a colon.  Since these are simple typos, we correct them.


Tuesday, November 15, 2022

Cleaning up the scanned images

Having scanned the pages at 600 dpi, gray scale, and then converted them to pure black and white, we need to look at each image to see that it is good enough for printing.  Experience tells us that there will be stray black and white bits where they should not be.

So the first step is to try to clean up those little bits.  We have a program that looks for a single black bit in a field of white, or a single white bit in a field of black.  At 600 dpi, you cannot see something that small.  And once we have that, we can expand it to a small set of bits in a field of other bits.  The question becomes: At what point does a small set of bits become part of the image, instead of just extraneous bits?  My original thought was maybe 40 bits.  Any clump of 40 bits or less, surrounded by a field of the opposite color can be erased without changing the image.

But working on that premise, I noticed the following panel (page 9):


The nose on this person is:

So the right nostril is 10 pixels in a 5x3 rectangle.  The left nostril is less than 35 pixels.  And if either of them was "cleaned up" as random noise, it would change the image significantly.  So it would seem that Arriola's drawings are meaningful at a very small number of bits.

Of course that is in the actual drawings -- the strips.  Outside the strips, any stray bits would be safely considered extraneous, and can be cleaned up.  Which leads us to another approach.  If we identify the "background" white paper regions that are not part of the strips, then we can clean up larger spurious black bits.  Which leads us to write  a program to identify the background of the page.  This is simply starting at the upper left corner and "flooding" the page until we come to a barrier, a set of black bits that surround the comic strips themselves.  If we turn these background bits to green to make it easy to see what we are classifying as background we get pages like:


The smallest group of meaningful bits that are not background would be individual panels, or letters, or the page numbers.  But even a page number, like the "1" on this page, is 100x300 pixels.


The smallest meaning character would be a period, which would be 40x40 pixels.  But in the background areas, we could reasonably clean up anything under, say 15x15 pixels.

At the same time, we ran across several pages where the holes for the binding went through part of the drawing -- some 20 pages had problems with the holes.  We used a bit editor (GIMP) to go in and fix up those pages.  For example,  page 89 was scanned as:

but using the bit editor, by hand, we restored it to


Friday, November 11, 2022

Black and White Gordo

The Gordo books are black and white, except for the covers.  There is some text on the introductory pages, but once we get to the actual comic strips, they are all just black and white.  Or maybe shades of gray?  When we scanned the images, we told the scanner program "Gray", but what did we actually get?

First we convert from TIFF to GIF, since most of our software works on GIF images.  Both formats are loss-less so  we can easily convert from one to the other.  For GIF images, we have a 256 entry color table of (R,G,B) values and each pixel in the image is an index into this table.  So any given image has no more than 256 different colors.  Different images, of course, might have different color tables, in which case the total number of colors may exceed 256, but for one image we have only 256.  TIFF files can hold up to 24 bits of color data (8 bits for each of R, G, B) for each pixel.

But of course, if we actually have gray scale, then the value of R is the same as the value of G and the value of B for each pixel, since gray is the result of equal R, G, B values.  So even with 24 bits, we still only have 256 different levels of gray.

We have a program that will read a GIF file and produce a list of all the different colors in the file, and the number of times each color is used.  If we run that on all the GIF files for both books, we find there are only 256 different colors, in all the files for all the pages, and each of those colors is a gray level, with R = G = B. 

If we plot the number of occurrences of each color in a file, for example p135.gif, we get a plot like:

where we see a number of black pixels on the left of the plot, a very small number of gray pixels, followed by a whole bunch of white pixels at the right of the plot. The minimum number of a color is 11,339 (90,90,90) and the maximum is 21,667,543 for (255,255,255) (white).  This is out of a total of 33,660,000 which is an 8.5 x 11 inch image at 600 dpi (5100 x 6600 pixels).  So for this image 64% of the pixels are pure white.

The second largest number of pixels (2,194,373) are for (248,248,248).  I suggest that for our purposes, the difference between (248,248,248) and (255,255,255) is not meaningful -- a person can not tell the difference between these two colors.  Both are effectively "white".  Similarly the next two most common colors are (14,14,14) and (9,9,9), both of which are effectively "black".  

If we create a similar graph for all the pixels in all the pages, we have the following:


which again has a small cluster of black pixels at the left, and a very high cluster of white pixels at the right, with a vast sequence of gray colors in-between which are almost never used. There is that unusual spike just to the left of the white spike.  We believe that is in fact caused by the scanning of the rectangular holes for the GBC binding.  If we take just the blank pages, which have nothing other than the holes and random variation from a white surface, and plot the colors from that we get:

Thus, I think if we collapse all the colors above from around 150 to be 255 (mapping all those really light greys to white), we will both get rid of the scanning artifact of the GBC holes, and get a much brighter, whiter, background white color.

Similarly, if we map all the colors from about 100 down to be 0 (black), we will get a solid black for the images.  That leaves a small number of gray level colors (between 100 and 150 to be considered.

If we try this on a sample from p135.gif, we start with


 and converting the range 0 to 100 to black (0) and 150 to 255 to white (255), we get


Notice that the GBC holes are gone.  Otherwise, the only change I can see is that the lamp shade is somewhat lighter.

This still leaves gray colors from 102 to 145 (for this image).  Where are those gray colors?  If we zoom in further, and convert all those gray level colors to red,


we can see that these gray colors are in the transition from black to white (or white to black).  If we convert all these to white, it will "thin" the strokes that make up the image; converting them all to black will make them "thicker".

However, about half way between these two numbers is 128.  If we use 128 as the dividing line between black and white, we would get something like:


where green represents all the colors above 128, and red all the colors below 128. It looks roughly equal, so that should not make the strokes thicker or thinner.